|
|
| Analysing transputer networks _____________________________________________________________________ |
| INMOS Limited 72-TCH-033 |
The Transputer Development System (TDS) is a software package which is used for developing applications for execution on transputers. The TDS contains facilities for loading and running code on the host computer (which may be a transputer) or on a network of transputers connected to the host. This technical note describes the mechanism employed by the TDS to retrieve information from a network which is being analysed for debugging purposes.
The debugging tools which incorporate the software which implements the network investigation technique described in this note are employed after a user program has been run on the network and failed in some way. They are independent tools which recover information about the state of the network at the time it was reset, rather than software which provides continuous monitoring of the condition of the user program while it is running.
Occam contains constructs which are used to specify the allocation of code to different processors in the network. The TDS compiler implements a subset of these allocation facilities which allows users to allocate occam compilation units to different processors. This specification is called the configuration. The following example configuration specifies a network of two processors which are connected by channel datalink placed on both processors at transputer link zero. The content of the compilation unit root is to be loaded onto the processor attached to the host computer and the content of the compilation unit node is to be loaded onto the other processor in the network. The textually first processor in a network is assumed to be connected to the host computer by a transputer link or serial line for loading and is referred to as the root processor.
{{{ PROGRAM using two processors
{{{F ... SC root (in) ... SC node (out) CHAN OF BYTE datalink PLACED PAR PROCESSOR 1 T4 PLACE datalink AT 4 -- Link 0 in root (datalink) PROCESSOR 2 T4 PLACE datalink AT 0 -- Link 0 out node (datalink) }}} }}} |
The compiler checks that the configuration described by the user is valid and that every processor is loadable from the root processor. The compiler also checks that the code to be loaded to each processor is available and is compiled for the correct processor type. The compiler produces a fold containing a description of the configuration specified by the user. This description is used by the analyse software to determine a path through the network to analyse every processor in turn.
The TDS is designed to enable users to develop their network software easily and quickly. This environment calls for a generalised debugging mechanism which is simple reliable and reasonably efficient. The debugging facilities provided as part of the TDS attempt to find the cause when something has gone wrong in the execution of an application on a network and the program has halted, set error, locked or in some other way appears to be incorrect. The debugging software then examines the processor state and memory of every processor in the network presenting the information in a manner which enables the user to relate it to the occam source of the program. No facilities are provided to interrupt, examine and restart a running application. It is expected that applications which require more than this ’post-mortem’ debugging technique will have a specific analyse technique designed.
The analyse strategy used by the TDS was developed after the network loading mechanism and is based very closely upon it. It is not the only way of analysing a network of transputers and may not be the best mechanism for many environments. The development of the loading scheme is described in an accompanying technical note ’Loading Transputer Networks’. The analyse mechanism was made as similar to the loading scheme as possible to shorten development time, for simplicity of maintenance and because the loading scheme had proved relatively easy to develop and was simple and efficient.
TDS debugging tools assist the user in finding coding errors by providing ’post-mortem’ browsing access to the registers and memory of all transputers in a network. The extent of the browsing facilities provided depends on the debugging tool used, some provide only the ability to locate to occam source text while others are able to display the contents of local variables and trace back procedure calls. All of the tools, however, have a common interface to the network of transputers being examined. This interface is maintained by an occam process residing on the host computer which keeps a map of the network as well as a certain amount of the information retrieved from the network. The debugging tool sends information requests to the interface process, which gathers the data together from the information it maintains on the host and the information still available from the network. The interface process controls all access to the processors in the network, routing requests to the required processor and assembling the information returned.
The characteristics of the analyse software to satisfy the requirements of the debugging tools and its development from the loader are described in the rest of this section.
The contents of all the registers and the complete memory as it was when the processor (was) halted must be available to the debugging software. Many of the processor registers can only be accessed by a program; running on that processor and consequently a program must be loaded onto each processor in the network. When the complete network has been loaded with the analyse process, the host interface process is a manager of a database, part of which is held in locally in the host and part of which is distributed on every processor in the network.
To avoid losing the contents of the memory locations into which this program is going to be loaded it is necessary to save the contents prior to loading the program. The memory is saved by reading it from the processor and saving it as part of a data base on the host computer. The data is accessed by ’peeking’ the memory prior to booting the processor with the program to access the registers. The transputer bootstrap facility which is employed when the memory of a processor is being peeked is described later in section 2.3.
The analysing program has to be distributed to each processor in the network and the information returned by each processor has to be returned to the host, so part of the task performed by the program loaded into each processor is to copy this information to and from the host. Before the analyse process is run each processor is loaded with a bootstrap and a loader which perform data retrieval, initialisation and loading tasks. The first part, the bootstrap, saves the values retained in registers about the previous execution state of the processor, initialises the transputer and then loads the second part. The second part, the loader, loads the analyse process (which is received as a set of message packets from the host, terminated by a zero length message packet) then transmits the information accumulated by the bootstrap back to the host and finally initialises the local workspace and then runs the code just loaded. The code loaded by the loader, the analyser, performs the tasks of distributing code and information to other processors in the network, returning information from other processors in the network and peeking neighbour processors which are not yet booted.
The bootstrap, loader and analyser are grouped together as a set of message packets which are sent by the host to a processor immediately after it has been peeked. This boot sequence is transmitted to each processor from the host, it does not propagate from one processor to the next. The debugging interface process on the host computer maintains all knowledge of the structure of the network, transmitting instructions to direct the actions of the analyser on each processor in the network. Processors in the network maintain no information about neighbouring processors.
The analyse communications transmitted from the host to the network are collections of single bytes and packets of bytes. The single bytes are commands which control the routing and loading of information. The packets of bytes are transputer code boot sequences being directed to an unbooted transputer. The boot sequence message packets are never greater than 60 bytes in length and a zero length packet terminates the sequence. The value 60 was chosen for a variety of reasons. Firstly, it is necessary to provide a buffer in the analyser for passing code on to other processors and the larger this is the more space the analyser uses. Secondly, a message protocol could be devised which simplified the analyser if the message length was never greater than 63. Thirdly, the buffer had to be large enough to contain the bootstrap part of the boot sequence for passing on to other processors in the network and a bootstrap capable of performing the initial analyse functions and loading the loader proved to be just under 60 bytes in length.
The debugging facilities provided as part of the TDS, interface to the analyse software described in this technical note. This section describes the requirements which the debugging facilities demand of the analyse software and how the analyse software satisfies these demands.
The TDS debugging facilities are designed for use when a loaded network has crashed by stopping, dead locking or has generated an error. The debugging takes the form of a post-mortem browser which examines the state of the processor at the moment of the crash.
The minimum level of help that a post-mortem debugging tool can provide to a user is to indicate the source location associated with the execution point at the moment when the processor halted. A debugging facility of this sort demands little of the analyse software other than to return from each processor in the network, its error condition and its instruction pointer at the moment it halted. Retrieving just these two items however, requires that the analyse software has the ability to transmit boot sequences to every processor in the network and return data from any processor to the host.
A slight refinement is to inform the user which instruction was being executed when an error occurred. The following occam fragment illustrates how this debugging facility could appear to the user.
overflow during constant addition of -1
INT a : SEQ a := 0 WHILE a <= no.of.reps SEQ ... perform action a := a - 1 -- cursor locates to this position |
In the above example, the user has typed - instead of + and the activity has continued until overflow occurs when a has the value MOSTNEG INT. Even this simple example shows how the TDS can provide useful debugging information, from which the program can easily be corrected by the user. The above example extends the initial requirement of the analyse software to enable the debugging tool to determine the contents of specified locations on a selected processor. This could be achieved by examining code files on the host or by adding the facility to the analyse software. The latter solution avoids any problems associated with changes in the loading strategies and provides a facility which is needed by more complex debuggers.
Adding the facility to examine the contents of specified locations on any processor demands that the analyse software is capable of passing requests to the selected processor and returning the data retrieved. It also demands that the complete memory contents are available even though some of the memory will be overwritten by the boot sequence necessary to access the data used to locate the instruction.
Extending the debugging requirements does not place significantly greater demands on the analyse software. Extending the debugging facilities to display to the user the processes on the queues or waiting for link transfers, requires the part of the analyser which accesses the instruction pointer and error state for the minimum locate facilities to retrieve other processor registers at the same time. All other debugging requirements, such as back tracing procedure calls and displaying the contents of selected workspace locations, can be met by the ability to access the contents of any location on any processor.
Summarising the facilities which the debugging tools require from the analyse software produces the following list.
The following state information at the moment when the processor halted must be retrieved
The contents of any location in the complete memory space.
This section shows how the analyse software meets the requirements of the TDS debugging tools. The analyse software aims to satisfy the requirements of the debugging tool which imposes the greatest demand, assuming that debugging tools which do not require all the facilities will simply not use them.
The primary requirement is to access the contents of transputer registers at the moment when the processor halted. The transputer hardware assists significantly in meeting this requirement in the following ways.
Details of other information available after booting an analysed transputer can be found in the document entitled ’The transputer instruction set - a compiler writers guide’ (ISBN 0-13-929100-8).
Most register information is only available to a program running on the processor. A program to access the register contents must read the available information and then initialise the processor registers to a state which allows normal program execution to proceed. The boot sequence of each transputer retrieves register information in a way which preserves all of the available data. The boot sequence loaded onto a processor obviously overwrites the previous contents of the memory locations where the boot sequence is loaded.
To provide the debugging tool with access to the contents of every memory location in the memory map of the processor it is, therefore, necessary to read the contents of the locations which are going to be overwritten by the boot sequence before it is loaded. Again the transputer hardware assists in meeting this requirement in the following ways.
The area of memory recovered prior to booting each processor is transmitted to the host so that requests by the debugging tool for the contents of memory locations is to a distributed data base; some of which is held by the individual processors throughout the network and some of which is stored in the host computer. The size and location of the memory recovered prior to booting is 600 bytes starting from MOSTNEG INT.
After the memory has been retrieved, the processor is loaded with a program which reads the contents of the processor registers for transmission back through the network to the host. The program loaded into each processor must also be able to pass on a similar program to processors further away from the host and copy the contents of specified memory locations back through the network to the host.
The processors are loaded with the analyse program in a sequence, determined by the host software, referred to as the bootstrap sequence. The host software also selects the specific bootstrap and analyser for each processor in the network and sends the code to the network, controlling any interaction with the root processor and reporting any failures.
The data retrieved from each processor is made up of two components; firstly the copy of the memory contents retrieved to become part of the distributed memory data base and secondly the processor registers contents. The processor register contents are used to determine the process state of the processor. The control of the bootstrap sequence and the recovery and management of all of the data retrieved by the network is handled by a single process. This interface process
From link connection information and processor load data provided by the compiler, the interface process builds a graph representing the network to be examined. From this data structure the order in which the processors in the network are analysed is determined.
To determine the order, the graph of the network is first pruned to a strict tree structure with only the shortest paths from the host to all the processors remaining. The analyse order is then determined from the tree by the following algorithm.
Analyse the root processor (the processor connected to the host). Then for links 0,1,2,3 in turn of the root processor, analyse the network attached to the link. If the link is connected to a processor, analyse the processor connected to the link, and analyse the networks connected to links 0,1,2,3 of the newly analysed processor. Note that the links are not necessarily used in the direction defined within the occam configuration.
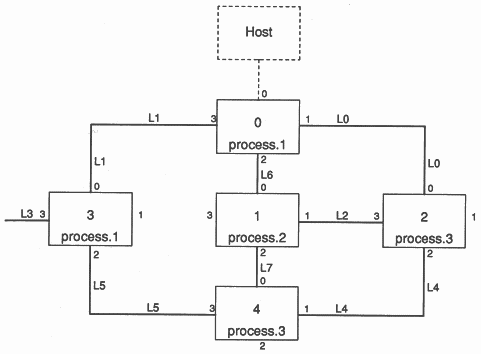
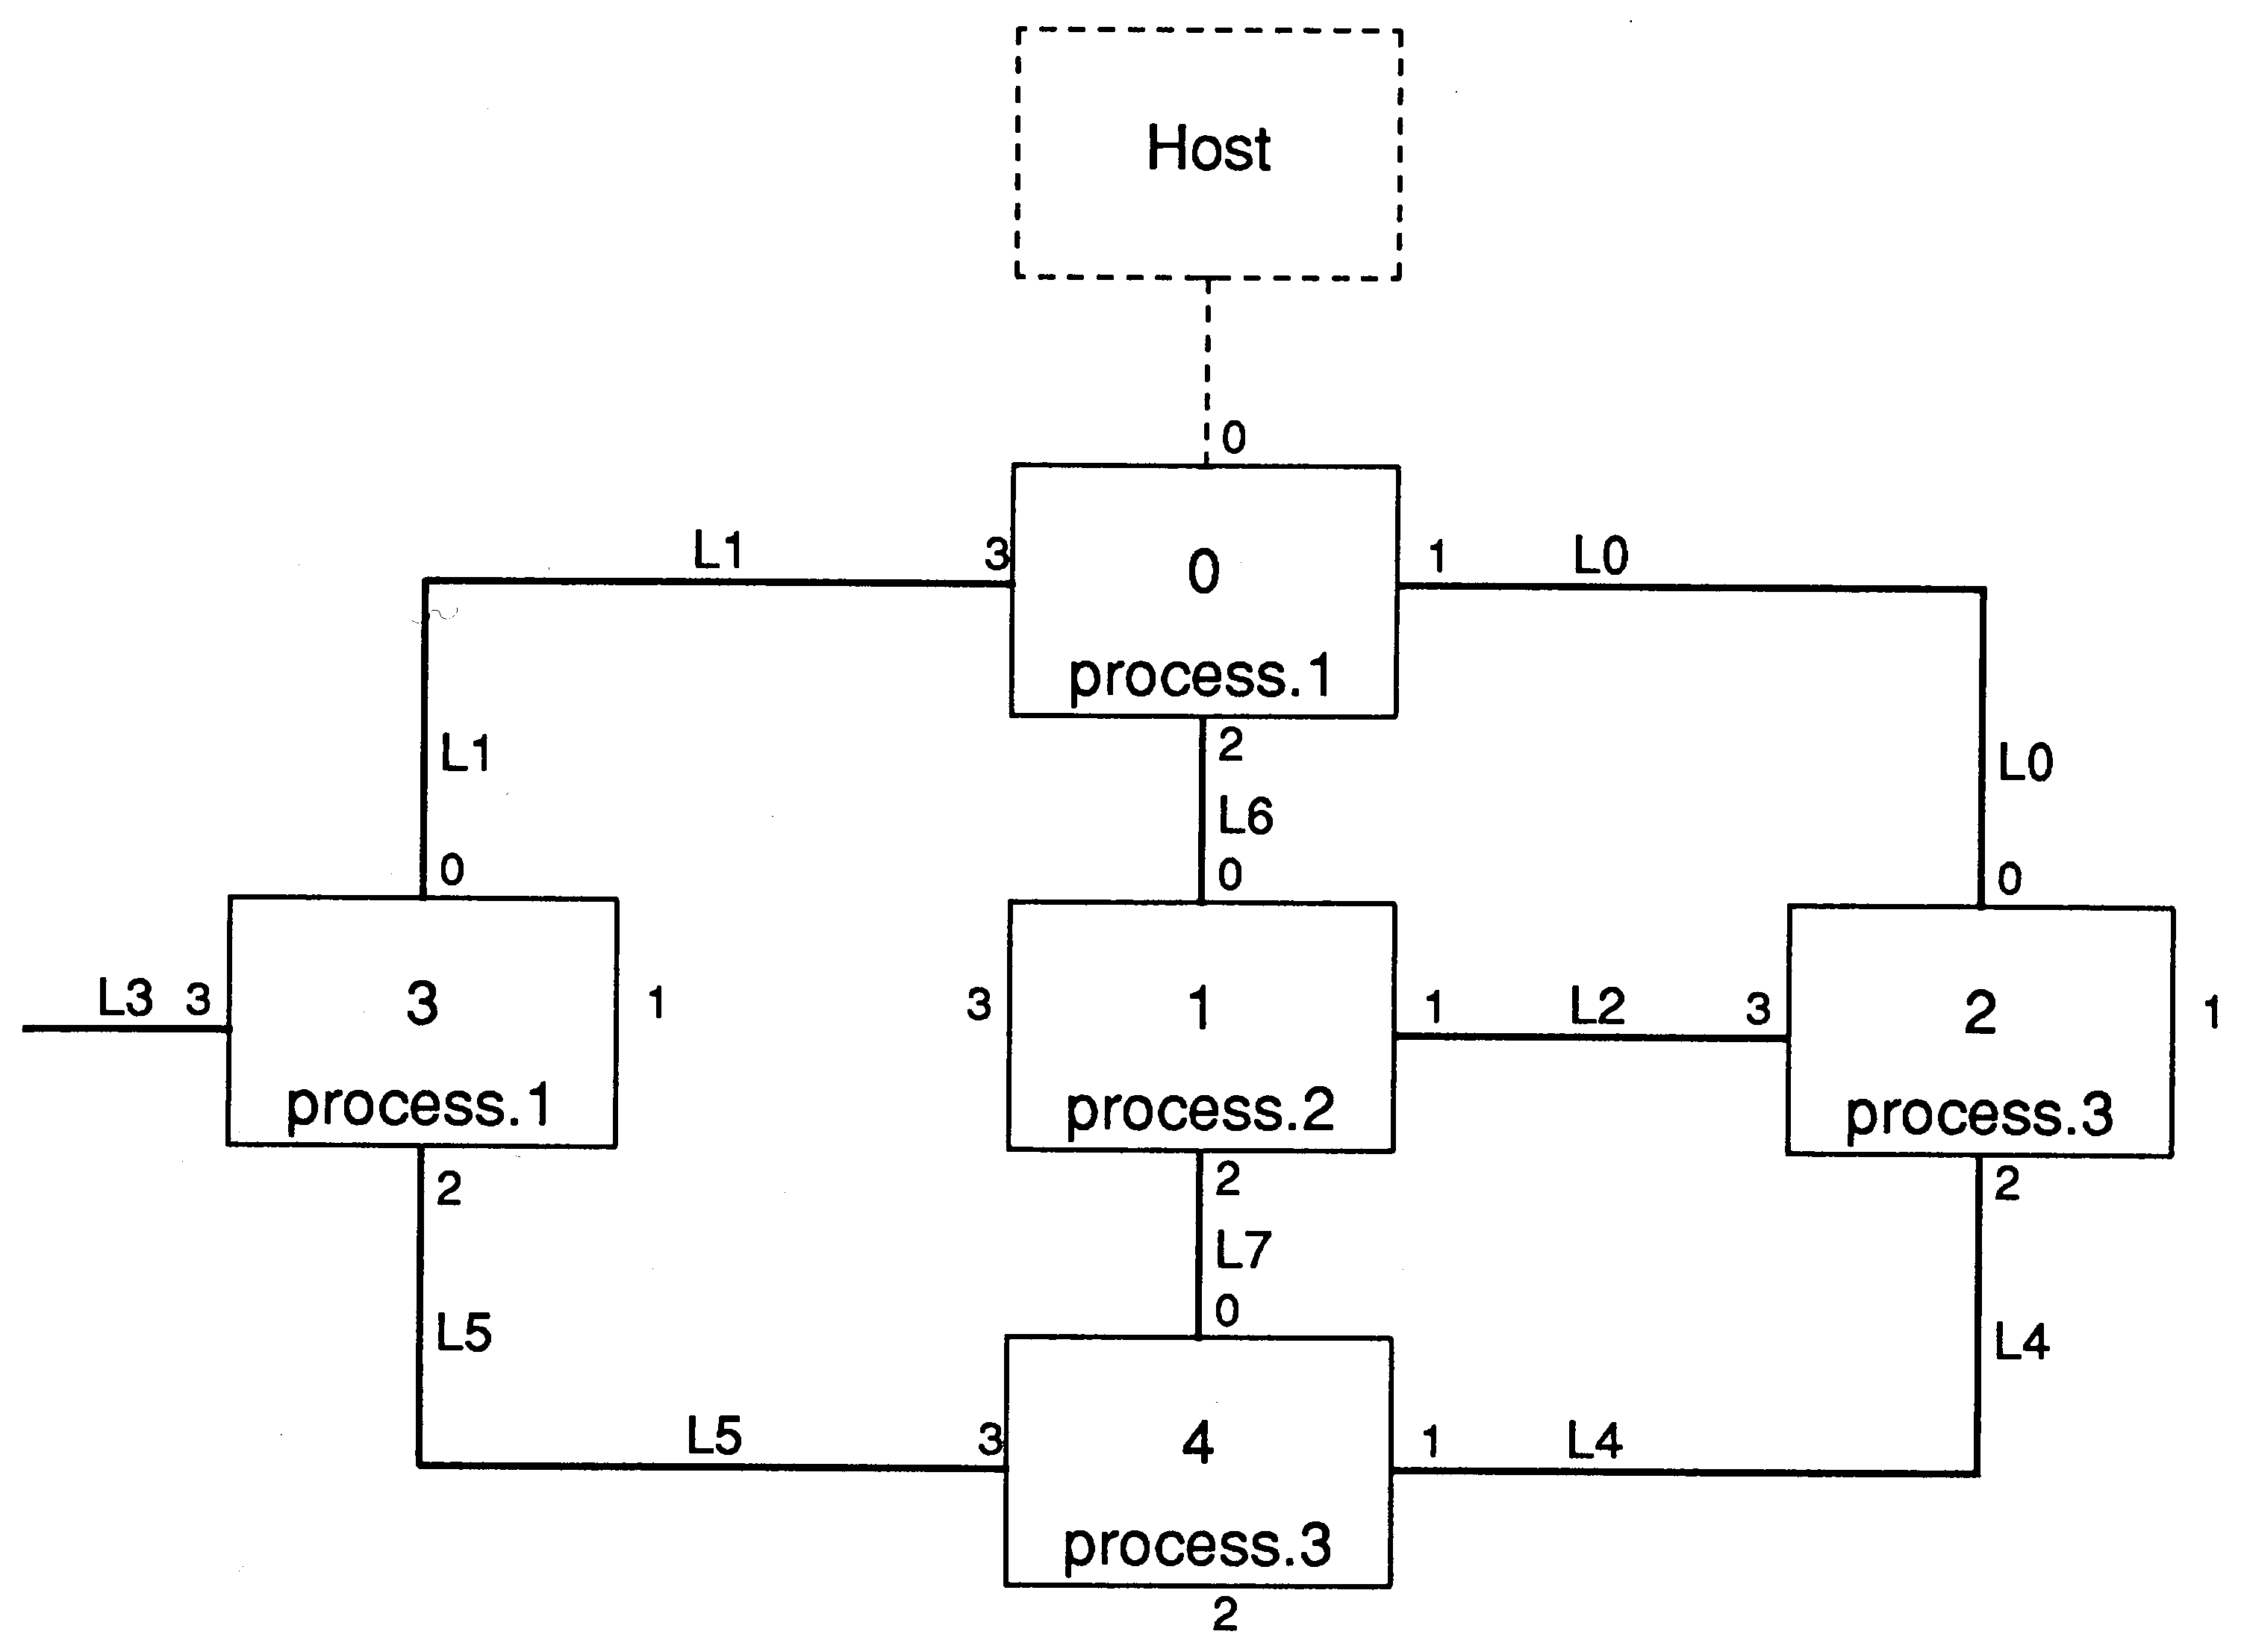
This can be illustrated with reference to the following example configuration:
... SC process.1
... SC process.2 ... SC process.3 ... definitions and declarations PLACED PAR PROCESSOR 0 T4 PLACE L1 AT link3.in : PLACE L0 AT link1.out : PLACE L6 AT link2.in : process.1 (L1, L0, L6) PROCESSOR 1 T4 PLACE L2 AT link1.in : PLACE L6 AT link0.out : PLACE L7 AT link2.in : process.2 (L2, L6, L7) PROCESSOR 2 T4 PLACE L0 AT link0.in : PLACE L2 AT link3.out : PLACE L4 AT link2.in : process.3 (L0, L2, L4) PROCESSOR 3 T4 PLACE L3 AT link3.in : PLACE L1 AT link0.out : PLACE L5 AT link2.out : process.1 (L3, L1, L5) PROCESSOR 4 T4 PLACE L5 AT link3.in : PLACE L7 AT link0.out : PLACE L4 AT link1.out : process.3 (L5, L4, L7) |
The above occam configuration can be represented by the diagram shown in figure 1.
This example configuration is analysed in the following order.
processor 0 from host
processor 2 from processor 0 link 1 processor 4 from processor 2 link 2 processor 1 from processor 0 link 2 processor 3 from processor 0 link 3 |
Analysing a processor proceeds in two stages, firstly the retrieval of a copy of an area of memory before the processor is booted and secondly, booting the processor. The copy of part of the memory of an unbooted processor is made by using the transputer ’peek’ bootstrap sequence to read the desired memory locations. The root processor is peeked by the host computer, all other processors are peeked by the preceding processor in the boot sequence which then transmits the peek data back through the network to the host computer. The host computer sends a command to a processor to direct it to peek the processor on a specified link.
The peek bootstrap sequence is given in the following lines.
In the above sequence, peek.command is a BYTE value and peak.address and peek.word are word values of the word size of the unbooted processor being peeked. At the same time as directing a processor to peek the processor attached to a link, the host computer must also inform the peeking processor of the word length of the processor about to be peeked. The requirement that processors must be able to peek other processors with a different word length causes the compiled code of the analyse program loaded on each processor to be different for different word-length transputers.
The 600 bytes starting from MOSTNEG INT are retrieved from the unbooted transputer prior to loading the bootstrap and analyse programs. The bootstrap, loader and analyser for each processor type are contained within the host interface process as a table of bytes organised as a sequence of length bytes followed by the specified number of bytes. The table is generated by a program provided with the TDS. This program contains within it a mechanism for inserting transputer instructions directly into the table, and for reading the code of a compiled occam program and adding the contents to the table. The bootstrap and the loader are coded directly into the table, the analyser, however, is written in occam.
After power-on or reset, a transputer waits until it receives a communication on any one of its links. If the value of the first byte of this communication is 2 or greater, then that number of bytes is input from the link into the memory starting at MemStart and the processor starts executing at MemStart The host debugging interface process sends the bootstrap to each processor as a length byte followed by the bootstrap code.
The bootstrap, the first packet of the boot sequence, is a short program which reads the contents of various transputer registers and then initialises the registers and some workspace. Section 5 ’Bootstrap code’ gives the full listing of the bootstrap which is written in transputer assembler instructions. The sequence of actions performed by the bootstrap is as follows:
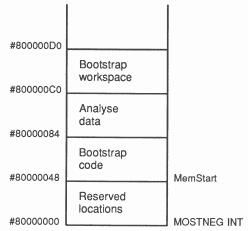
The bootstrap is loaded by the transputer at MemStart. When the register contents are recovered and the initialisation is complete, the bootstrap loads the loader at MemStart and then jumps to MemStart to enter the loader. Because the bootstrap loads the loader at the same location as itself, the bootstrap is at least two bytes longer than the loader (so that the instruction by which control is passed to the loader is not overwritten by the loader code being loaded). The space occupied by the bootstrap and the loader is used by the third part of the boot sequence, the analyser, as a communication buffer and consequently, the bootstrap is always padded to the buffer size.
The memory layout for a T4 transputer while the bootstrap is running is given in the following diagram.
Addresses for the T2 and T8 which correspond with those given in the above diagram for the T4 are given in the following table.
| Transputer | T2 | T4 | T8 |
| MOSTNEG INT | #8000 | #80000000 | #80000000 |
| MemStart | #8024 | #80000048 | #80000070 |
| Bootstrap top | #8060 | #80000084 | #800000AC |
| Analyse data top | #807E | #800000C0 | #800000E8 |
| Workspace top | #8086 | #800000D0 | #800000F8 |
The loader, which is the second packet of the boot sequence, is a short program capable of loading contiguous blocks of code into memory. The code of the loader, which is written in transputer assembler instructions, is listed in section 6 ’Loader code’. It performs two different functions, firstly, it is used to load the analyser and secondly, after all of the code of the analyser has been received and loaded it transmits the initial analyse data recovered by the bootstrap back to the host. The sequence of actions performed by the loader is given in the following list.
The loader is loaded by the bootstrap at MemStart. The loader starts loading the analyser at the first free location after the workspace reserved by the bootstrap. The messages input by the loader are a sequence of length byte and data packet pairs which are loaded at consecutive locations from the start point onwards. After the zero length byte terminator has been received, the saved analyse data is transmitted to the link booted from followed by a zero length byte terminator. The message buffer used by the analyser for passing bootstrap code on to unbooted processors and returning peek, analyse and dump data to the host is set up by the loader to occupy the same area as the bootstrap and loader code - the 60 bytes starting at MemStart. The code position and workspace layout while the loader is loading the analyser is the same as when the bootstrap is running.
The third component of the boot sequence loaded onto each processor is the analyser. The analyser is a short occam program which distributes code to other processors in the network and copies data from the network towards the host. Only one connection through the analyser is active at any one time so that all communications are via the boot link to the host or via one of the other links, the current link, to the network. The analyser obeys a sequence of commands received from the host which direct it to perform the following functions:
The information received by the analyser from the host is a stream of single byte commands and packets of code, the structure of the commands is described in detail in the next section. The information transmitted by the analyser to the host is a stream of single byte length counts and packets of data. The commands are nested within bracketing command bytes so that each processor can interpret commands for itself, remove one level of bracketing and pass on commands intended for another processor later in the analyse path. The occam source text of the analyser is listed in section 7 ’Analyser occam’.
The commands received by the analyser are structured in such a way that only one function is being performed by the network at any one time. Consequently the system can be regarded as having four components:
An analyse transaction consists of a set of communications from the host computer to the target processor followed by a set of communications from the target processor to the host computer. The complete set of these transactions is given in the following list.
All intermediate processors on the analyse path copy communications from an input link to an output link. The communications are structured so that the intermediate process can always determine from which link the next input will be received.
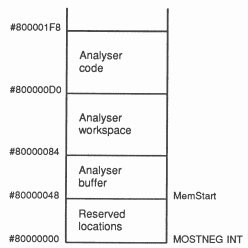
The memory layout for a T414 while the Analyser is running is given in the following diagram.
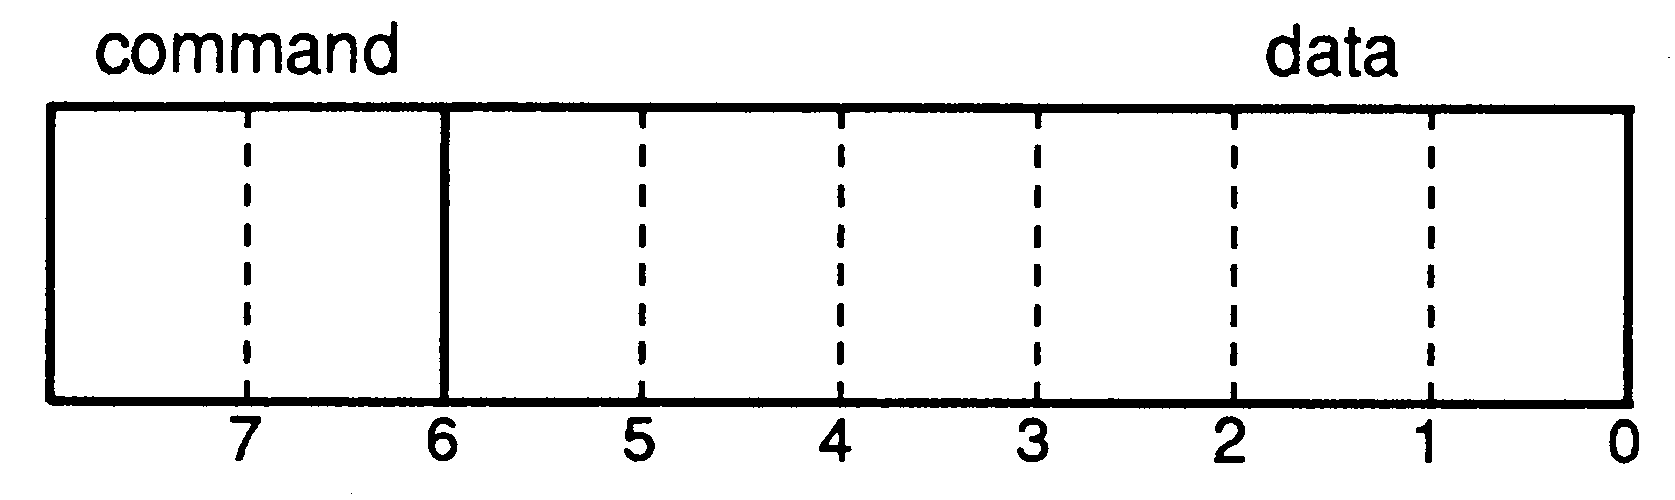
Analyse commands and data transmitted to and through a transputer consists of a word length independent mixture of single bytes and packets of bytes. The single bytes are commands to be interpreted by the analyser to control the routing of information, the packets of bytes contain the bootstrap and analyse program for unbooted processors.
The commands are applied using an operand word as a parameter to the command. The value in the operand word is created by OR’ing in the bottom six bits of information from the command byte into the bottom six bits of the operand word. One of the four command values allows this to be repeated by shifting the value in the operand word six places ready to receive another six bits. The command bytes are thus encoded from two components:
These two bits define the command which should be applied to the current value contained in the operand word after the data part of the command byte has been OR’d into it. The operand word is always cleared after obeying a command other than PREFIX.
These six bits provide the data (operand) part of the received character. This data is always OR’d into the bottom of the operand word which is used according to the command code in the top two bits of the received byte.
The packets of bytes always follow a MESSAGE command. By making the value of MESSAGE 0 (zero), a MESSAGE command will be interpreted by an unbooted transputer as a length byte and, consequently bootstrap sequences conform to the command structure. All message packet transfers are sent and received on transputer links as single communications.
The analyser action in response to input commands is described in the following paragraphs.
The current link is set to the value of the data part of the number command. The number will not contain prefixes. NUMBERS can also occur following an address function, where they are interpreted as a dumb address and a length count as described below.
On receipt of a message command which indicates that the message is of length greater than zero, the analyser will input a message packet from the boot link into the buffer and then copy both the message command and the message packet to the current link. A message command of zero is a terminator and the analyser prepares to receive reply communications from the current link for transmission to the link booted from.
There are five functions as follows:
The examples which follow show how simple and more complex analyse requests are encoded and directed to the recipient transputer fog the configuration described in section 2 ’TDS debugging’. The symbols used in the examples have the following meaning.
communications from the host to the network
{bootstrap} -- a message containing bootstrap code {} -- a message of length 0 used as a terminator p -- a number used as to set up the current link #300 -- a number used as the dump address or the -- number of bytes to dump p2 -- the function Peek2 p4 -- the function Peek4 ( -- the function Open ) -- the function Close A -- the function Address communications from the network to the host [data] -- a block of retrieved information [] -- a block of length zero used as a terminator ... -- sequence of preceding item |
Before the bootstrap is sent to the single processor, the host computer must peek the 600 bytes starting at MOSTNEG INT from the unbooted transputer. The following occam fragment shows how the host computer peeks the initial 600 bytes from the first transputer in the network.
WHILE more.to.peek
[4]BYTE peek.address, reply.word : SEQ ... create address to examine in peek.address to.network ! BYTE 1 to.network ! [peek.address FROM 0 FOR target.bytes.per.word] from.network ? [reply.word FROM 0 FOR target.bytes.per.word] ... copy reply data out of reply.word ... decide if more.to.peek |
The sequence to analyse only processor 0 is given in the following lines.
{bootstrap} ... {}
[data] [] A #300 #20 [data] [] |
This analyse sequence boots the first processor and then reads the initial analyse data. The analyser loaded onto the processor is then requested to copy the 32 bytes, starting at offset 768 (#300) from the most negative address, back to the host computer. In this case both the initial analyse sequence and the requested memory dump only require a single data packet.
Analyse instructions for transputers not directly connected to the host are bracketed between an Open and a Close function. Each transputer removes the first and last brackets and passes the contents byte by byte to the current link. If the analyse items for processor 0 and 2 are not included, the sequence to analyse processor 4 and then read 256 (#100) bytes starting at address offset 4608 (#1200) is given in the following lines.
1 ( 2 p4 )
[data] ... [] {bootstrap} ... {} [data] [] 1 ( 2 ( A #1200 #100 ) ) [data] ... [] |
The first command, the number 1, sets link 1 as the current link on processor 0, the following items between the open and close brackets are copied to link 1. Processor 2 sets link 2 as the current link and then peeks 600 bytes from the memory of the four bytes per word processor connected to the current link returning it to the host as 10 packets of 60 bytes. The bootstrap for processor 4 is then passed to it and the initial analyse data is copied back to the host. The request for the data dump is then passed by the same route to processor 4 and the requested data passed back as four packets of 60 and 1 packet of 16 bytes.
A transputer connected to a host computer by means other than a transputer link must be set to boot from ROM. The ROM code must then receive bootstrap and analysing information from the communication medium and perform the load accordingly. Inmos transputer evaluation boards are designed so that a board which is booted from ROM will receive its load commands from an RS232 serial port. Normally only the root processor (i.e. the processor connected to the host) is set to boot from ROM.
The Inmos evaluation boards communicate with the host using a standard protocol which is described below.
The first three bytes received from the host are used to determine the baud rate of the transmission, the communication mode and the operating function required. Each correct wakeup character read is acknowledged by transmitting an acknowledge (ACK) code to the host computer, an incorrect character is acknowledged with a not acknowledge (NAK) code. The three wakeup sequence bytes are described in more detail below.
In order to avoid transmitting 8-bit binary values to a host computer all values transmitted to the host are printable ASCII characters. The following standard definitions are used:
VAL ACK IS ’0’ :
VAL NAK I3 ’3’ : VAL HEX IS "569ABDGHKMNPSVYZ" : |
The 16 values of the HEX table above are used instead of the hexadecimal digits 0,1...E,F. The values are used to encode all binary numbers that have to be transmitted to the host as well as to encode all input from the host if the startup sequence include the ’H’ code to indicate encoded transmission. Encoded binary data is thus transmitted as two ASCII characters that can be used to create a single byte value. For example:
#00 is received as ’5’ followed by ’5’
#42 is received as ’9’ followed by ’B’
#FC is received as ’S’ followed by ’Z’
The ASCII characters have been chosen so that they are all at least two bits different from each other, and each one has an even number of bits set (even parity with a zero parity bit).
Every message packet transmitted from the host is followed by another byte value; i.e. messages from the host have one more byte than the number given in the operand word. This extra byte is a checksum value: the checksum is correct if the exclusive or of all the bytes in the message and the checksum itself yields a zero value. If the checksum is correct then the board responds with an ACK to the host; otherwise the board responds with NAK to the host. Checksums and handshaking are not used when communication is via links.
The first part of this section lists the local workspace used by the bootstrap and the loader, which should be read with reference to this workspace layout.
VAL next.address IS 0 : -- start of next block to load
VAL message.length IS 12 : -- input message length VAL links IS 12 : -- links start address VAL from.boot IS 13 : -- link booted from VAL to.boot I3 14 : -- reply link VAL MemStart IS 15 : -- start of boot part 2 VAL occam.start IS 16 : -- first available word for occam VAL occam.entry IS occam.start - (links - 1) -- first available word for occam after workspace adjust prior to -- call of occam procedure. -- analyse data offsets VAL old.Iptr IS 1 : -- previous Iptr VAL old.Wptr IS 2 : -- previous Wptr VAL low.front IS 3 : -- low priority process queue -- front pointer VAL low.back IS 4 : -- low priority process queue -- back pointer VAL high.front IS 5 : -- high priority queue front pointer VAL high.back IS 6 : -- high priority queue back pointer VAL old.error IS 7 : -- previous error state VAL old.halt.error IS 8 : -- previous halt on error state VAL fpu.error IS 9 : -- previous floating pt error state VAL low.time IS 10 : -- contents of low priority timer VAL high time IS 11 : -- contents of high priority timer --VAL bootlink IS 13 : -- link booted from |
The initial workspace requirement is found by reading the workspace requirement from the analyser occam and subtracting the size of the workspace used by both the loader and the bootstrap (temp.workspace).
initial.work.space := (occam.workspace - links) - 1
IF initial.work.space < 3 initial.work.space := 3 -- space for process TRUE SKIP |
The bootstrap is listed in a transputer assembler format. It was however, actually developed by using an occam program to encode defined values into a table ready for insertion into the TDS debugging tool.
-- set up workspace and save registers
start: ajw initial.adjustment stl old.Iptr -- save old instruction ptr stl old.Wptr -- save old work space ptr stl from.boot -- save link booted from -- save analyse information -- work out MemStart ldc start - addr0 -- distance to start byte ldpi -- address of first instruction addr0: stl MemStart -- save for later use -- save queue registers ldlp low.front -- pointer to analyse data slots to savel -- save low priority process queue pointers ldlp high.front -- pointer to analyse data slots to saveh -- save high priority process queue pointers -- reset queue registers mint -- Not Process to stlf -- reset low priority queue mint -- Not Process to sthf -- reset high priority queue -- save error conditions testerr -- test if error flag is clear eqc 0 -- invert flag. i.e. False = False stl old.error -- save in analyse data slot testhalterr -- read halt on error stl old.halt.error -- save in analyse data slot -- save high and low priority time values ldc addr2 - addr1 -- offset to high read timer instruction ldpi -- address of high read timer instruction addr1: stl high.time - 1 -- store Iptr in w.s slot at high.time - 1 ldlp high.time -- point future high Wptr at high.time runp -- start high priority read time process j addr3 -- skip high priority code addr2: -- start of high priority code ldtimer -- read high priority time stl 0 -- store value in Wptr[0] (= high.time) stopp -- exit back to low priority addr3: -- remainder of low priority process ldtimer -- read low priority time stl low.time -- save value in low.time -- load and enter loader ldc 0 stl message.length -- zero message length BYTE variable ldlp message.length -- pointer to message length variable ldl from.boot -- address of boot link ldc 1 -- bytes to load in -- input length byte ... insert null instructions so bootstrap is exactly 60 bytes ldl MemStart -- start of area to load loader ldl from.boot -- address of link ldl message.length -- loader size in -- input loader code packet ldl MemStart -- start of loaded code gcall -- enter loader |
The loader is produced by the same mechanism which produces the bootstrap. Both programs become single message packets preceded by a length byte (which is also an analyser MESSAGE command) and are transmitted from the TDS debugging tool interface process through the network as MESSAGE communications.
-- save fpu error if T800
fptesterr -- test if fp error flag is clear eqc 0 -- invert stl fpu.error -- save as part of analyse data -- load analyse occam -- set up analyse load position ldlp occam.start -- pointer to end of local workspace stl next.address -- save as start of area to load loader -- load analyse code packets startload: ldlp message.length -- pointer to message length variable ldl from.boot -- address of link ldc 1 -- bytes to load in -- input message length byte ldl message length -- message length cj endload -- stop if 0 bytes ldl next address -- pointer to area to load next packet ldl from.boot -- address of link ldl message.length -- message length in -- input code packet ldl message.length -- message length ldl next.address -- address loaded to bsub -- adjust load area by packet size stl next.address -- save area to load j startload -- go back for next block endload: -- work out reply link ldc -4 -- output link - input link ldl from.boot -- from boot link wsub -- address of to boot link stl to.boot -- save for later use -- output accumulated analyse data ldl to.boot -- address of link ldc packet.length -- bytes to send outbyte -- output message length ldlp old.Iptr -- start of data buffer ldl to.boot -- address of link ldc packet.length -- bytes to send out -- output saved info ldl to.boot -- address of link ldc 0 -- terminating zero outbyte -- output terminator -- set up remaining occam workspace and call analyse mint -- bottom of memory stl links -- address of output links ajw links - 1 -- work space for occam (links is new W1) ldlp occam.entry -- pointer to load address in new workspace gcall -- enter analyser |
This section lists the occam source of the analyser. It is included as part of the table in the TDS debugging tool by the program which ’assembles’ the bootstrap and loader, as a sequence of MESSAGE command message packet pairs.
Command and function constant definitions used by the program are given below.
VAL message.length IS 60 :
VAL n.blocks IS 10 : VAL data.field IS #3F : VAL data.field.bits IS 6 : VAL tag.field IS #C0 : VAL tag.field.bits IS 2 : VAL message IS 0 : VAL number IS 1 : VAL function IS 2 : VAL prefix IS 3 : VAL tag.prefix IS prefix << data.field.bits : VAL boot2 IS 2 : VAL boot4 IS 4 : VAL open IS 5 : VAL function.open IS BYTE ((function << data.field.bits) \/ open) : VAL close IS 6 : VAL function.close IS BYTE ((function << data.field.bits) \/ close) : VAL address IS 7 : |
The overall layout of the procedure is as follows.
PROC T4.analyse (
[8]CHAN OF ANY links, CHAN OF ANY from.boot, to.boot, [packet.length] BYTE buffer) ... constants INT link : INT copy.reply : SEQ link := 0 WHILE TRUE input.link IS links[ link + 4 ] : SEQ copy.reply := 0 ... perform activity ... copy reply if necessary : |
The fold marked perform activity contains the following occam.
output.link IS links[link] :
BYTE command : INT operand : INT work.var : -- general variable used wherever needed SEQ from.boot ? command work.var := (INT command) >> data.field.bits operand := (INT command) /\ data.field IF work.var = message SEQ output.link ! command IF operand <> 0 SEQ from.boot ? [buffer FROM 0 FOR operand] output.link ! [buffer FROM 0 FOR operand] TRUE copy.reply := 1 work.var = function IF ... operand = open ... operand = address ... operand indicates must peek at next processor TRUE SKIP TRUE -- work.var = number link := operand |
The choices depending on the value of operand when the input command was function are given in the following fragments. The first choice is when the operand value indicates that the following command should be copied to the current link.
operand = open
INT depth : SEQ SEQ depth := 1 WHILE depth <> 0 SEQ from.boot ? command IF command = function open depth := depth + 1 command = function.close depth := depth - 1 TRUE SKIP IF depth <> 0 output.link ! command TRUE SKIP copy.reply := 1 |
The second choice is a request for a quantity of data from a specified address.
operand = address
INT dump.address : SEQ SEQ i = 0 FOR 2 BOOL more : SEQ dump.address := work.var work.var := 0 more := TRUE WHILE more SEQ work.var := work.var << data.field.bits from.boot ? command work.var := work.var + ((INT command) /\ data field) more := (INT command) >= tag.prefix WHILE work.var <> 0 INT this.packet : SEQ IF work.var > message.length this.packet := message.length TRUE this.packet := work.var to.boot ! BYTE this.packet [4]BYTE memory : PLACE memory AT 0 : to.boot ! [memory FROM dump.address FOR this.packet] dump.address := dump.address PLUS this.packet work.var := work.var - this.packet to.boot ! BYTE 0 |
The third choice is a command to peek the next processor.
(operand = boot2) OR (operand = boot4)
[4]BYTE peek.address : PLACE peek.address IN WORKSPACE : SEQ INT32 i.address RETYPES peek.address: i.address := 0(INT32) peek.address[operand - 1] := #80 (BYTE) SEQ i = 0 FOR n.blocks SEQ work.var : = 0 WHILE work.var < message.length SEQ output.link ! BYTE 1 output.link ! [peek.address FROM 0 FOR operand] input.link ? [buffer FROM work.var FOR operand] work.var := work.var + operand []INT i.peek.address RETYPES peek.address: i.peek.address[0] := i.peek.address[0] + operand to.boot ! BYTE work.var --message.length to.boot ! [buffer FROM 0 FOR work.var] to.boot ! BYTE 0 |
The fold marked copy reply if necessary contains the following occam.
IF
copy.reply <> 0 BYTE length : INT i.length : SEQ i.length := 1 WHILE i.length <> 0 SEQ input.link ? length to.boot ! length i.length := INT length IF i.length <> 0 SEQ input.link ? [buffer FROM 0 FOR i.length] to.boot ! [buffer FROM 0 FOR i.length] TRUE SKIP TRUE SKIP |
[1] ”Transputer Development System”, Prentice Hall, London 1988
[2] ”Transputer Reference Manual”, Prentice Hall, London 1988
[3] ”The Transputer Instruction Set - A Compiler Writers’ Guide”, INMOS Ltd, Bristol
[4] ”Exploring multiple transputer arrays”, Technical note 24, INMOS Ltd, Bristol
[5] ”Loading transputer networks”, Technical note 34, INMOS Ltd, Bristol